Census-S
Developed by: IRSA informatica

Census constitutes a group of programs for the management of electronic censuses based on the topographical management of the objects surveyed. Census-S is the module for managing the census of road signs.
The keeping of the signaling census is indispensable for the implementation of the Directives for the drafting of the Urban Traffic Plan (G.U. N.146 of 24/6/1995). Art. 124 of the Rules of the Highway Code requires periodic checks on the state of conservation of the signs and the assessment of compliance with the actual traffic needs and users' needs.
End users
Public Bodies (Municipalities, Provincial Administrations, ANAS, etc.) owners or managers of communication routes.
Private companies that own or manage communication routes.
Purpose of the software
The Census-S program allows you to track and manage the maintenance and restoration of road signs.
The signage census allows you to have all the fundamental information relating to the signaling systems installed and the signals present in each system. It also keeps memory of the plants and / or signals removed, so as to also have historical database.
The signage database can be constantly updated. Appropriate data query functions allow you to program maintenance and recovery interventions for damaged, expired or in any case to be replaced signals. Using a special price list it is also possible to immediately quantify the cost of the material that needs to be restored.

Census-S is a program that basically allows you to manage a database consisting of the following archives:
a database (filing cabinet) which stores information relating to the main characteristics of each system with related signs.
a graphic database that stores the location of the signaling systems in the area.
a set of auxiliary tables that allow optimal information management.
In addition to the program, the following are provided:
Predisposition for graphic management
Pre-compiled basic tables (list of signs required by the Highway Code, pictograms of signs, types of film, types of support, etc.).
General flow of operations
In summary, the flow of operations for inserting implants is as follows:
Open the Planimetry joining panel (menu Management | Planimetry).
You select the Quadrant concerned and select it by clicking with the mouse inside it.
Inside the quadrant, the area in which the road is located is identified and zoomed in as it deems most appropriate so as to have a fairly detailed view of the area in which the system is installed.
To insert a new signaling system, double click on the point where it is positioned. The program opens the mask for entering the data relating to the system and the signals present.
The criterion with which Census-S was designed is that of maximum completeness combined with maximum simplicity. In fact, only with a simple and flexible tool is possible to keep the data updated and therefore maintain their validity over time.

Graphical database
Through the Planimetry the user has the possibility of:
View the signage systems installed in the area of competence,
Insert new signaling systems,
Edit (modify) existing plants.
The graphical archives of the program are made up of a framework of union and a number of Quadrants that vary according to the different realities to be managed (size of the Municipality, scale in which the drawings are available, etc.).
Union framework
The union picture consists of an image in which the whole area that you want to manage is represented (e.g. municipal area) divided into squares that represent the different quadrants.
Access to the union framework can take place either with the appropriate item in the menu (Management | Planimetry) or by clicking on the button available in the toolbar.
The squares identified in the union picture by blue lines identify the quadrants, numbered progressively with Roman numerals starting from the bottom left. Any transverse lines that fill a box identify the unavailable quadrants (generally these are panels that are located outside the municipal area).
Graphic window management
Some simple commands are available in the graphic windows present in the program (connection panel and dials) which allow you to "move" on the drawing in the most appropriate way. The commands are made available through some buttons on the toolbar.
Zoom In - Enlarges the image.
Zoom out - Shrinks the image.
Previous zoom - View the previous zoom level.
100% Zoom - Displays the image in its normal size.
Aerial view - Opens a small window where you can move around the whole area of the drawing.
Zoom box - This is the command that allows you to have greater control over the type of zoom you want to obtain.
Planimetry dials
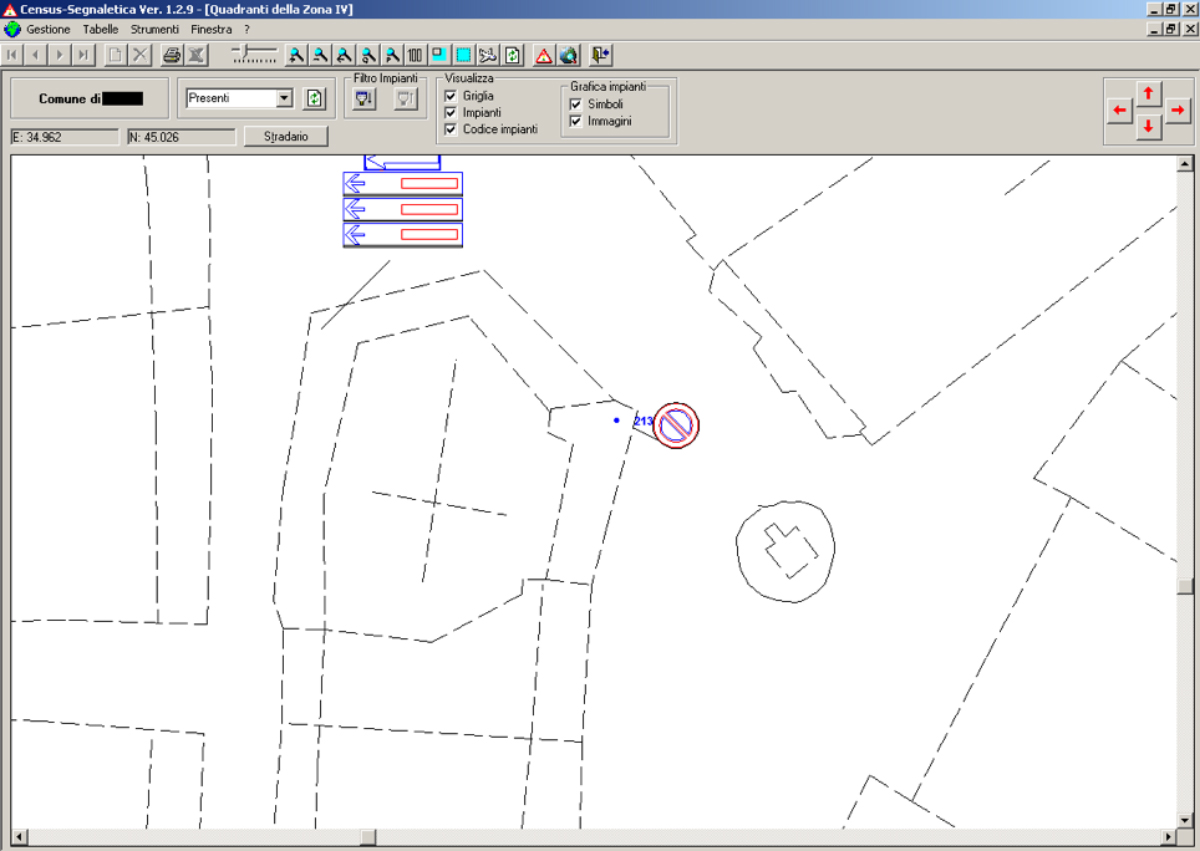
Clicking on a point inside a box in the Union framework opens the corresponding Quadrant. This is the graphic object on which the plants are placed, and represents, in the scale chosen when customizing the program, a delimited area of the territory on which it operates.
The quadrant shows the paths of the roads in the selected area of the territory and the plants present or possibly removed. The plants are displayed in the form of a small circle whose color indicates the "state" of the plant: the blue color identifies the plants present, the red color indicates those removed, but in any case present in the database for historical archive purposes.
On the graphic image it is possible to make enlargements, reductions and displacements with the same management commands of the graphic windows seen for the Union framework.
Note: when viewing a quadrant with Zoom 100 or at any rate with a high scale, it is possible that multiple signaling systems nearby are represented with a single symbol. To get a detailed view of the plants present in a point, you need to zoom in on a smaller area.
The display window of the dials has, in addition, some special buttons, which are explained below.
Combo box for selecting the type of system to be displayed. By clicking on the arrow it is possible to select to display in the graphic window: a) only the systems currently PRESENT; b) only the REMOVED implants; c) ALL implants, both those present and those removed. As already said, the removed implants differ from those present in the red color. To change the type of system displayed, first select through the combo box, then click to confirm on the button to regenerate the drawing.
Enable or disable the filter defined in the plant mask. Since in the plant management mask it is possible to perform filters to display only the plants that have certain characteristics, with the button in the Plant filter box it is possible to make sure that the plants with the same filter criteria set on the mask are displayed on the dial of management. The other button allows you to disable the filter and then displays all the systems.
Plant code enabling and disabling buttons. With these buttons in the Plant codes box it is possible to display or hide the code of each plant displayed.
Through the Quadrants window it is possible to insert or "edit" the implant data.
Insertion of a new signage system
To insert a new plant, simply double click with the mouse on the point of the plan where the plant must be represented. Of course, in order to perform the insertion in an appropriate way it is good to zoom in on the affected area. After double clicking, the program displays the mask for entering the system data. In the mask there is already the Code that will be attributed to the new system (progressive number within the archive).
Modification or visualization of plant data
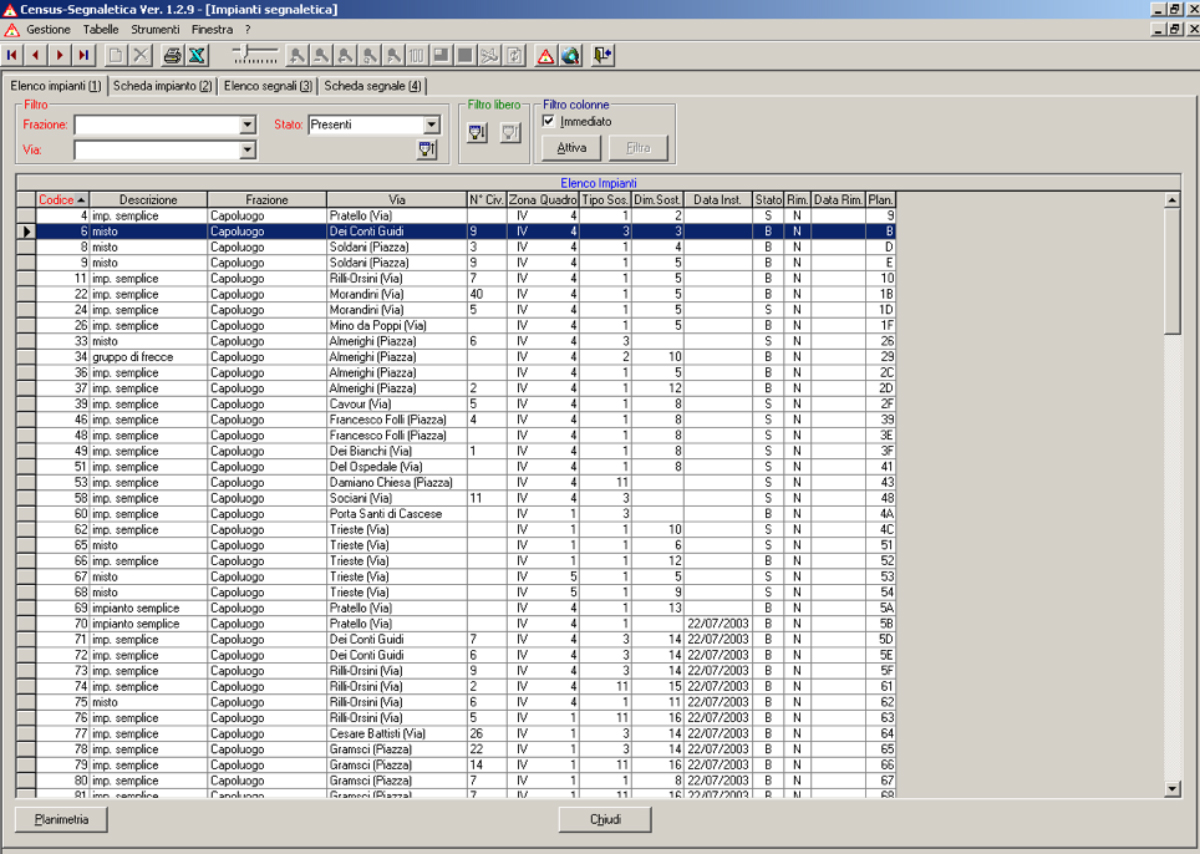
If, on the other hand, you want to view the mask with the data of a system, just double click on the circle that represents the system itself. In this case the program opens the mask displaying the data of the system, on which it will then operate according to the needs (display, printing, modification, etc.).
Plant Management Mask
The plant management window can be opened either through the program menu (Management | Census of signs) or by clicking on the appropriate button on the toolbar.
The window is also opened and activated by making a "double click" inside a Quadrant in the planimetry management.
The use of the mask is very simple and intuitive. It consists of four tabs: 1) List of plants; 2) Plant card; 3) List of signals; 4) Signal card.
The registered plants are displayed in the first tab. By selecting a plant (positioning the cursor on the corresponding row) and passing on the Plant tab, the data relating to that plant are displayed. The following tab shows all the signals that make up the system. To view or modify the data relating to a signal, just select it and go to the next tab (Signal tab).
List of plants
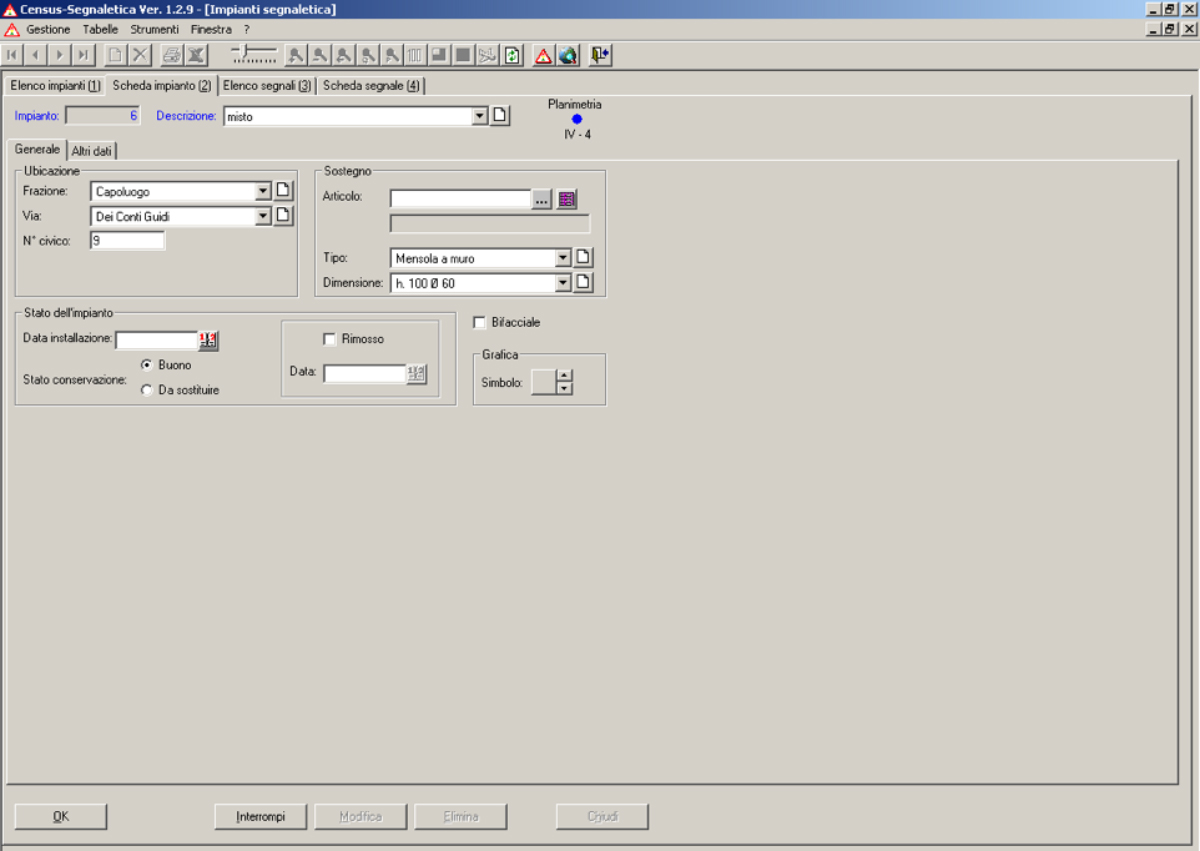
The Plant List tab is the tool through which it is possible to "navigate" easily in the database. In fact, it shows the list of all the plants surveyed, grouped by hamlet and street where they are located. Two types of filter allow you to view only systems that have certain characteristics, thus allowing you to operate more easily on a reduced range of data.
The list is displayed in a "grid" in which each line corresponds to an installation. The columns show the main attributes of each plant. Not all columns are visible on a screen, but you can view the side columns by moving the cursor on the horizontal scroll bar.
Each column can be resized as desired by the user: the program automatically memorizes the changes in width made and reproduces them in the same way at subsequent openings of the mask.
It is possible to view any lines that do not appear on the screen by moving the cursor on the vertical scroll bar with the mouse.
Filters
The mask has two types of filter: a quick filter and a much more powerful "free filter" even if it is more complex to manage.
The Quick Filter is applied on three data: fraction, street, plants removed.
Normally the removed implants are not displayed. If it is necessary to operate on one or more implants that have been removed, click on the appropriate box (Removed) and confirm by clicking on the "tick" button. In this way all the implants are displayed, both those present and those removed. Therefore, the Removed box is not used to display only the implants that have that characteristic, but performs an inclusion operation, adding to the present implants also those removed.
Note: It is also possible to view only the removed implants. For this, however, you must use the free filter.
As far as the fraction and the street are concerned, it is possible to select a fraction and / or a street in the relevant combo boxes. By clicking on the Apply filter button, only the systems located in the specified fraction and / or street will be displayed.
The button with the deletion sign present next to the filter application button allows you to clean up all the criteria set with the quick filter, and therefore shows all the plants other than those removed.
The free filter is the most powerful one as it allows you to filter systems based on any attribute (field) relating to the system and the signals present in it.
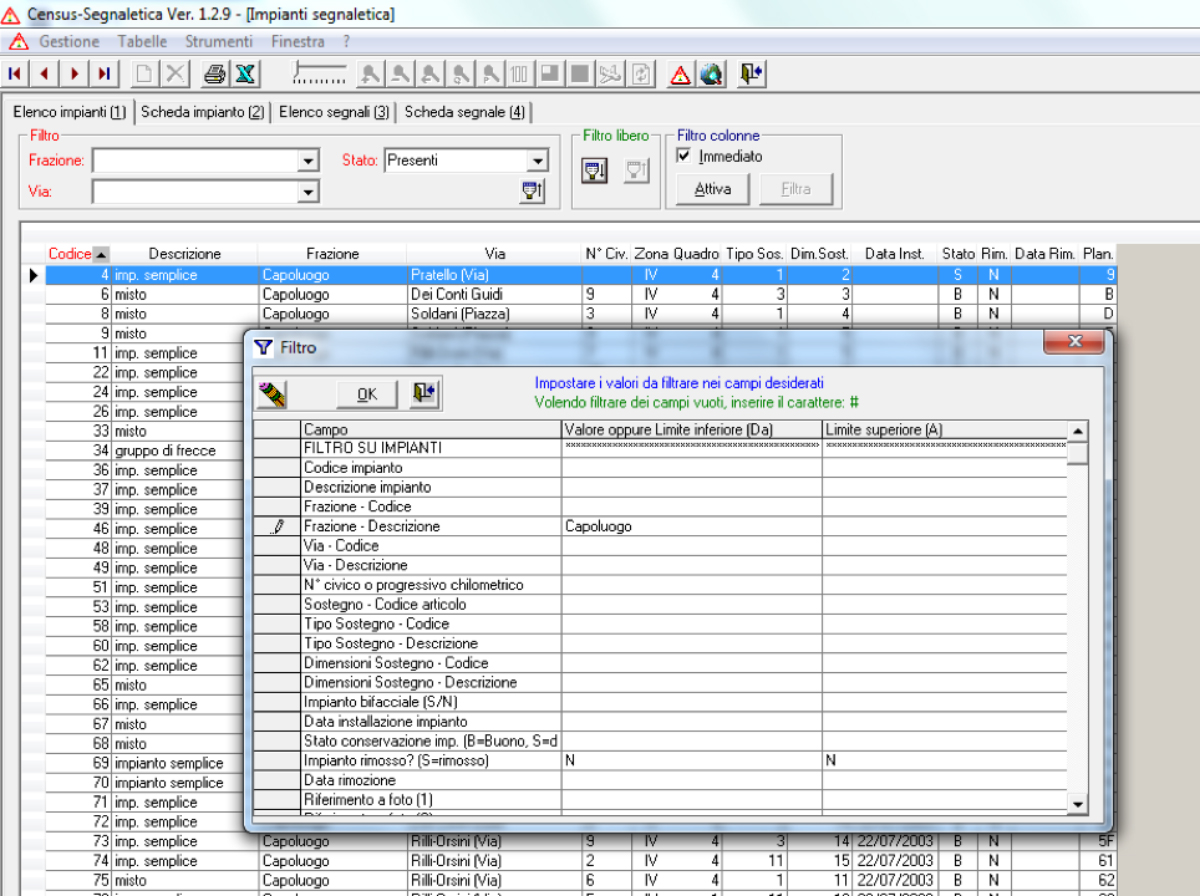
To set the filter, click on the button. This opens a "grid" mask that allows you to define the filter criterion.
The first column of the grid lists all the fields (attributes) of the plant archive followed by the fields of the signal archive.
Filter on a value
If you want to set a filter on a field, just indicate the condition in the second column (the central one). For example, if you want to view all the plants that have a given type of support, just indicate the description of the type sought in the second column of the line "Type of support - Description". For example, writing WALL SHELF we will have the result of displaying all the systems that have this type of support (in the management of the filters the program does not distinguish between upper and lower case letters, however it requires that the value be indicated exactly; therefore if there is no type of support having exactly the text indicated as a description, no system will be displayed).
Filter on a range
If, on the other hand, you want to filter all the values included in a range, you must define the limits of the range using both columns on the right (second and third columns). For example, if we want to list only implants with a code between 20 and 30, we will insert 20 in the central column (lower limit) of the Implant code row and indicate 30 in the right column (upper limit) of the same row. In this way, the program filters all systems that have a value between the lower limit and the upper limit (extremes included).
Wildcard filter (*)
Often the values you want to use as a filter do not exactly match the text in the field. For example, we might want to filter all the systems in which there are signals with figures that have the word PREVIOUS within the description. If we indicate in the central column of the row "Figure - Description" the text PREVIOUS no plant will be displayed, because the filter as it is set searches for descriptions of figures that are exactly like the text set. In order to perform this filter, you must enter the search text as follows: * PREVIOUS *
The asterisk (*) is used as JOLLY, i.e. it replaces any sequence of characters. Therefore the text entered in the example would mean: it finds all the systems that have at least one signal with the description of the figure that starts with any sequence of characters, followed by the text PREVIOUS and followed by any series of other characters. In this way all the figures of the type GIVE BACK, RIGHT OF PRECEDENCE, etc. would be identified.
Filter on empty values (#)
Sometimes it may be necessary to perform a search on fields that contain null values. For example, we may wish to extract all the systems for which the installation date has not been indicated. In these cases, you must enter the character # in the second column (Value) of the row of the field concerned. In the example shown above we should go to the "Plant installation date" line and put the # sign as the value to be searched.
Combined conditions
If you indicate filter values on several lines, the conditions are considered all valid, so the data that satisfy ALL the conditions set are extracted in the filter, as if they were linked together by the logical operator "E". It is not possible to perform multiple filter conditions with the logical operator "O" (which selects the data that satisfy even one of the conditions set).
Buttons in the filter setting screen
In the filter setting mask there are buttons that allow you to do the following: It allows you to delete all the data in the second and third column (eliminates any filter conditions set) Apply the filter: it searches and shows the result in the grid of the Plant List. It exits the filter definition mask and does not perform searches on the data (renunciation).

Command buttons
The following command buttons are present in the Plant List tab:
New signage system
It allows to insert a new system in the archive. The program activates the Plant tab page, prepares a new progressive code for the plant to be inserted and waits for the entry of the data relating to this plant. However, it is important to note that this is not the normal and recommended system for adding new plants to the database. In fact, the normal mode is to start from the planimetry, indicating to the program the position in which the implant to be inserted is located. The insertion method starting from the data management mask is present as an alternative to the normal one, if the user, for some reason, needs to follow this different sequence of operations. In this case, he can subsequently place the implant on the plan with a "drag and drop" operation.
Planimetry
This button allows you to view the graphical representation of the plant on the plan. The quadrant in which the implant is located is identified and the graphic element that represents it highlighted in green is displayed.
In the grid with the list of plants, the last column on the right with the heading "Plan." Contains the reference to the graphic object that represents the plant on the plan. The reference consists of a numeric code that identifies the graphic element in the graphic database. It could be the same as the code that the system has in the systems database, but this correspondence is random.
If the reference is absent, it means that the plant does not have a representation on the planimetry, and therefore it is not possible to call up the planimetry using this button. Likewise, it is not possible to call up the plant representation in the plan if there are no plants in the list.
Signaling system sheet
Signaling system code
The system code consists of a progressive number managed entirely by the program without the possibility of user intervention. When a new system is inserted, the program assigns it the first available progressive code, which will uniquely identify that system in the archive.
Description of the signaling system
Each plant has a succinct description that helps identify it in the archive. This description can be taken from the list of available descriptions, or it can be managed completely freely, depending on the user's preferences.
Plan button
Next to the description of the system, there may be a small circle-shaped button that signals the presence of the system in the plan. The color of the circle corresponds to the color of the graphic symbols present in the plan: the blue color indicates an implant present, the red color an implant removed. Pressing with the mouse the colored "dot" automatically activates the dial on which the implant is present and this is highlighted with a green circle.
Hamlet
Select the name of the hamlet in which the plant is located from the list.
Road
In the list associated with the combo box there is the abbreviated name of the streets of the municipality. This description is the one that should allow a faster search for the desired element, as it starts with the most significant part of the name of the street or square, etc. followed by the other elements enclosed in round brackets. For example, if the full name was VIA GUGLIELMO MARCONI, in the short description it would be reported as: MARCONI (VIA GUGLIELMO). This is however only a general indication, and the user can freely organize the street table.
House number
In this field it is possible to indicate the house number where the system is located. In the case of extra-urban roads it is possible to indicate the progressive mileage.
Support
The identification data of the support are the type and size, which correspond to the data present in two tables that can be freely managed by the user. In addition to these, it is possible to use a system coding field (Article code). This field allows you to manage a table (Support Articles List) in which to encode the different types of support marketed, also indicating the standard market price. The use of these data is optional, but they can allow the user to have valuable information when forecasting the maintenance of the systems. In fact, it becomes possible to query the data relating to the census of the plants to obtain the list of plants that need replacing with the calculation of the market cost. In this way, it is easy and quick to estimate the costs that the Administration has to face in order to restore damaged supports.
Double sided
This checkbox is used to report double-sided implants.
Plant status
In the System status box it is possible to indicate: the installation date of the system, the conservation status to indicate the systems that must be replaced. In addition, in a special box it is possible to report whether an implant has been removed and its removal date. In this case, the system will not normally be present in the list, unless the user requests to view also the systems removed, for the purpose of documenting historical data.
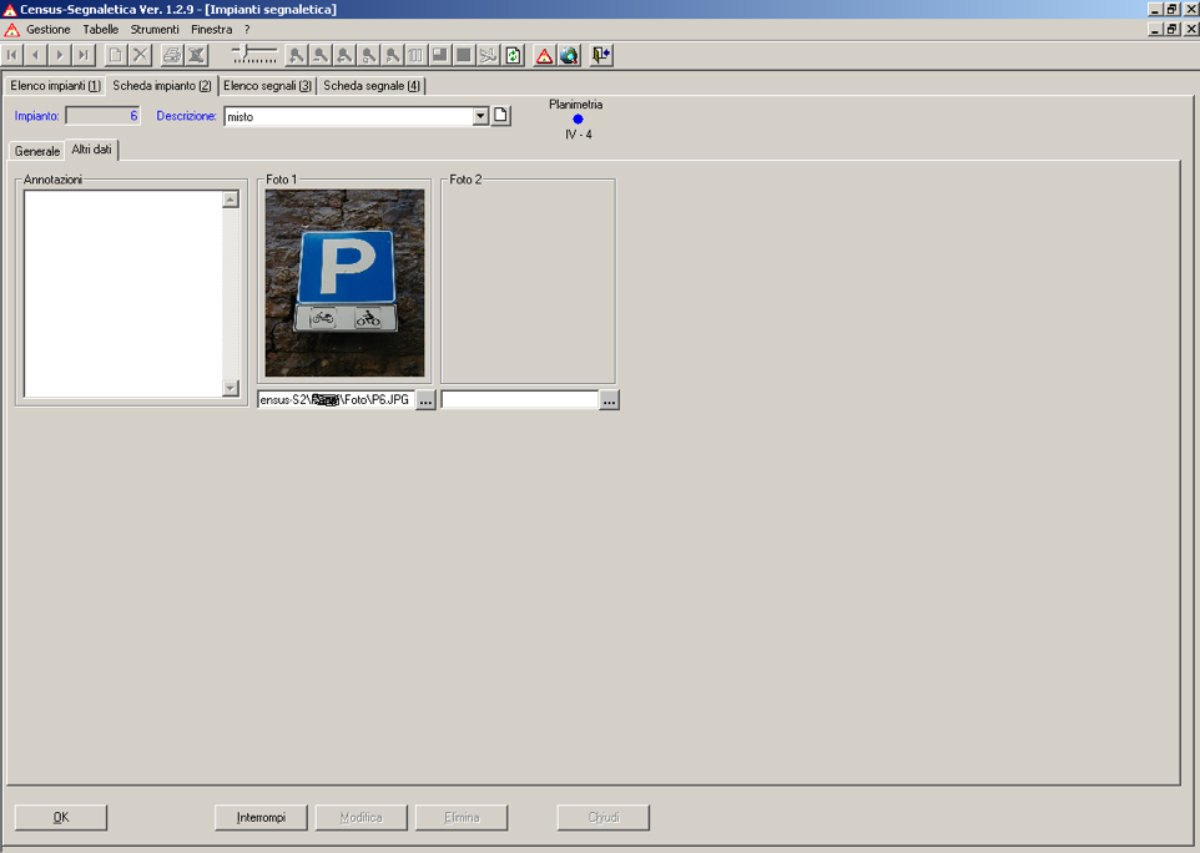
Remarks
The Annotations field, present on the Other data page, allows you to enter various notes relating to the system. The entered text can be as long as you like. The field is also manageable within the filters, so it is possible to trace plants also through information entered in this free text field.
Photo
Up to two photos can be managed per system. The photos must have been taken and stored in files. The program does not impose a mandatory folder in which to store photos, however it is advisable to use the subfolder Archives \ Photos. In any case, by clicking on the Search button you can explore the system and locate the photo file. The program displays a preview of the photo in the box provided in the mask.
If you want an enlargement of the photo, simply double click on the preview. This opens the zoom window which can be sized as desired. It is also possible to perform zoom operations as on the plan. The only difference is in how the "Zoom Box" function is managed. In fact in the Planimetry first you need to click on the button in the toolbar, then you identify the box on the drawing. Instead in the case of the photos, it is necessary to proceed differently (this is due to the diversity of the programs that manage the operations in the two different cases): first you need to locate the box on which you want to zoom on the photo, then click on the button to zoom in.
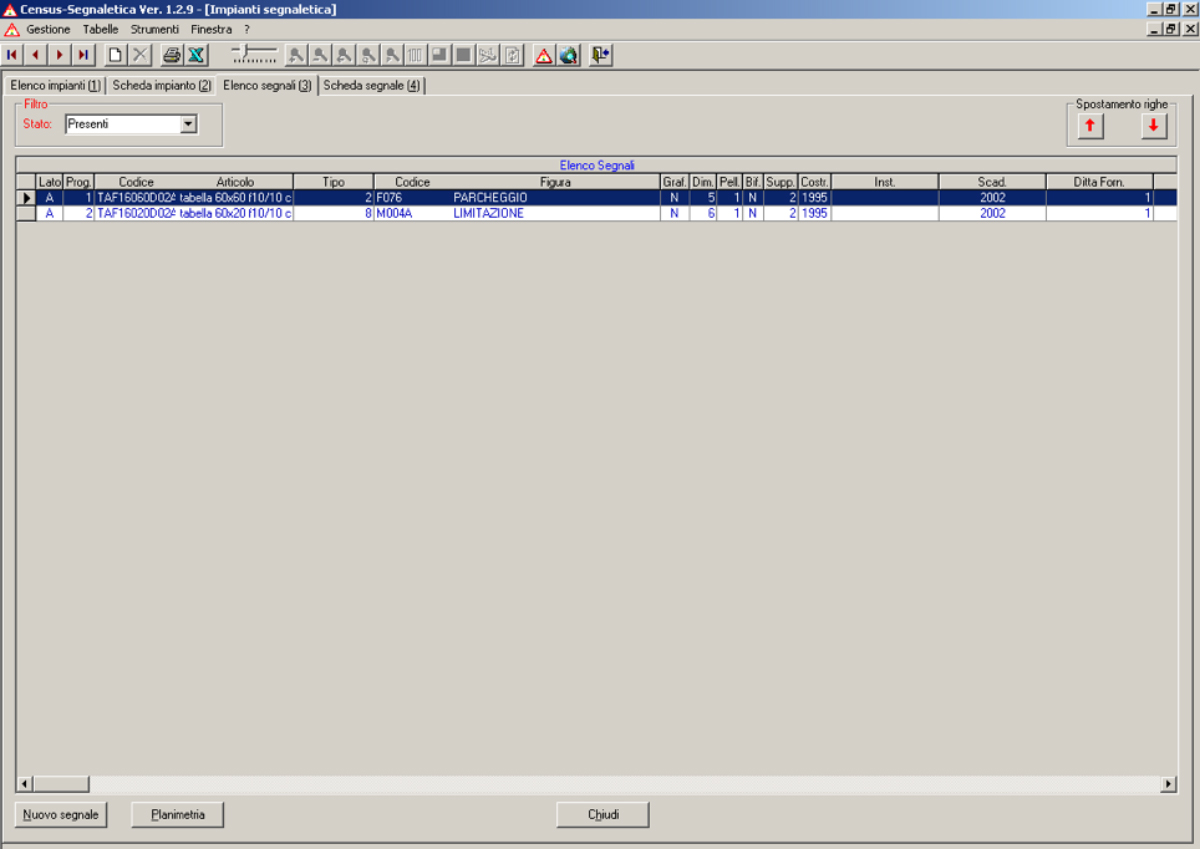
Signals list
The page n. 3 of the mask shows the list of signals present on the selected system. It is also possible to view any signals removed by selecting the appropriate check box in the box for the filters.
The management of the mask is completely similar to that on the first page (list of plants).
The data relating to each signal are displayed on each row of the list. The detailed display and modification, as well as the insertion of new signals, can be carried out on the next page (Signal card).
Signal card
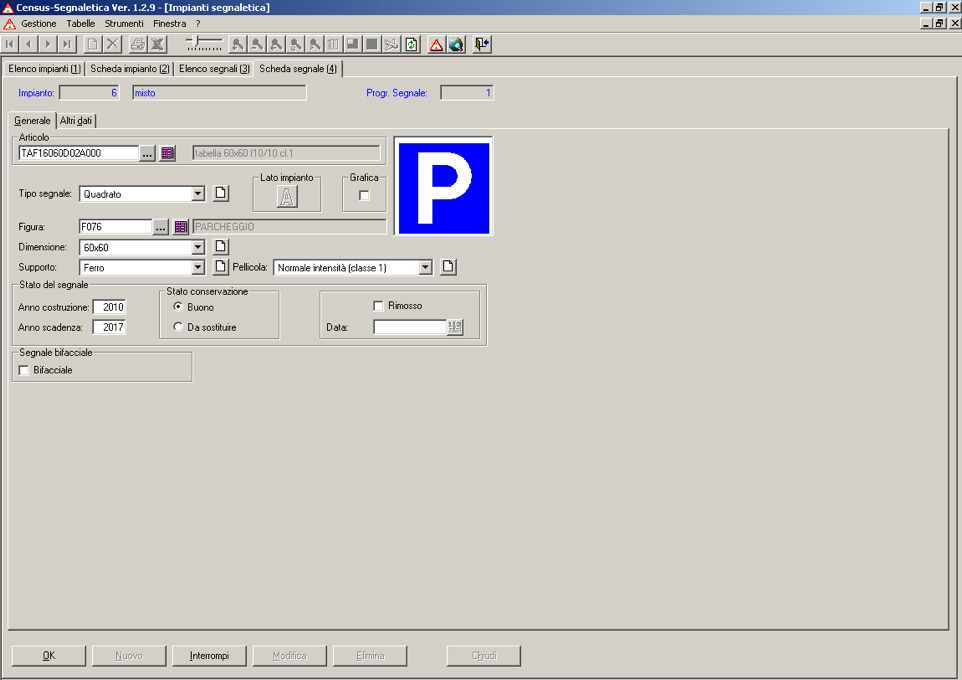
On page 4 of the mask we have the tab with the data relating to the signal selected in the Signal list. It is also possible to enter the data of a new signal.
Each signal present in a system is identified by a unique progressive number (relative to that system), which is automatically assigned by the program, in a manner similar to that which occurs for the system code. Therefore also the progressive code of the signal is a field of display only.
New signal
When entering the data of a new signal, the operator has two possibilities. The first possibility is to select the article corresponding to the signal to be inserted from the Signage List. If this item is encoded in the price list, the program is able to automatically manage the forecast of the recovery costs when the signal has to be replaced.
The search button and the Insert New button allow you to select the article from the price list or to insert it if it is not present. In the case of selection from the price list, the program takes all the information from the table and automatically loads it into the form, also speeding up its compilation.
The second management option is to enter information directly, without links to the article archive. The user will manually enter all the necessary information, and will not be able to automatically perform a signal enhancement in case of need for reset. Despite this, the program will still signal the signal when its replacement is needed.
Figure
This field allows you to indicate the figure present on the signal. The program has an archive that contains the list of all the figures envisaged by the highway code with the relative graphic representation (pictogram). Using the search button it is possible to select the figure concerned from the list of those present in the archive. In the search mask it is possible to see in addition to the code and the description of the figure, also the relative pictogram. The data of the selected figure are loaded into the mask and the pictogram is displayed in the appropriate box.
The other fields on the page are easy to use and similar to the similar signage system sheet.
Construction year - Expiry year
A particular mention must be devoted solely to these two fields. In the first, the operator will insert the year in which the signal was built. The program will automatically calculate the expiry year based on the type of film used, based on current regulations, calculating 7 years for class 1 film signals (normal intensity) and 10 years for other types of film.
In the State of preservation box, the user will report damaged signals that need to be replaced in advance of the normal expiry date as to be replaced.
When requests are made for the signals to be replaced, the program will list both the signals that are due to expire due to the expiry of validity terms, and those that are reported as "to be replaced" for external reasons.
Other data
On the second page of the Signal card, other data can be managed which complete the information relating to the individual signal. In particular, it is possible to indicate:
Order number and date.
Name of the company that provided the signal.
Name of the company that performed the installation.
Installation date.
A variable text at will with various annotations relating to the signal, in order to indicate any other data for which a specific field is not provided by the program.

